Communicating Complex Problems through Visual Research Deliverables
July 2025
Company: Xometry
My Role: UX Designer
Background
Xometry’s current order management system is not equipped to handle complex orders with multiple ship dates (MSD). The system's inability to natively capture these orders forces internal staff to rely on time-consuming and error-prone manual workarounds. This inefficient process creates a significant increase in workload for employees and elevates the risk of data entry errors, ultimately leading to a frustrating experience for both staff and customers.
Our goal is to design a visual framework for presenting research findings that:
Clearly communicates the complexity of the MSD problem
Breaks down the logic of the current user journey
Fosters empathy for the user
Engages stakeholders and encourages discussion
Serves as a shared source of truth for the team
Target Audience:
Product Managers
Engineering
Designers
Deliverable Highlights
The final deliverable is a comprehensive process flow diagram. It’s organized to show the journey of a manual quote (MQ) with multiple parts including the customer communicating their MSD needs to manually grouping and splitting the orders into a job so the manufacturing parter can understand the full scope of the job, then cancelling the job so the partner can get paid after each shipment, rather than at the end of a large order with multiple parts over time.
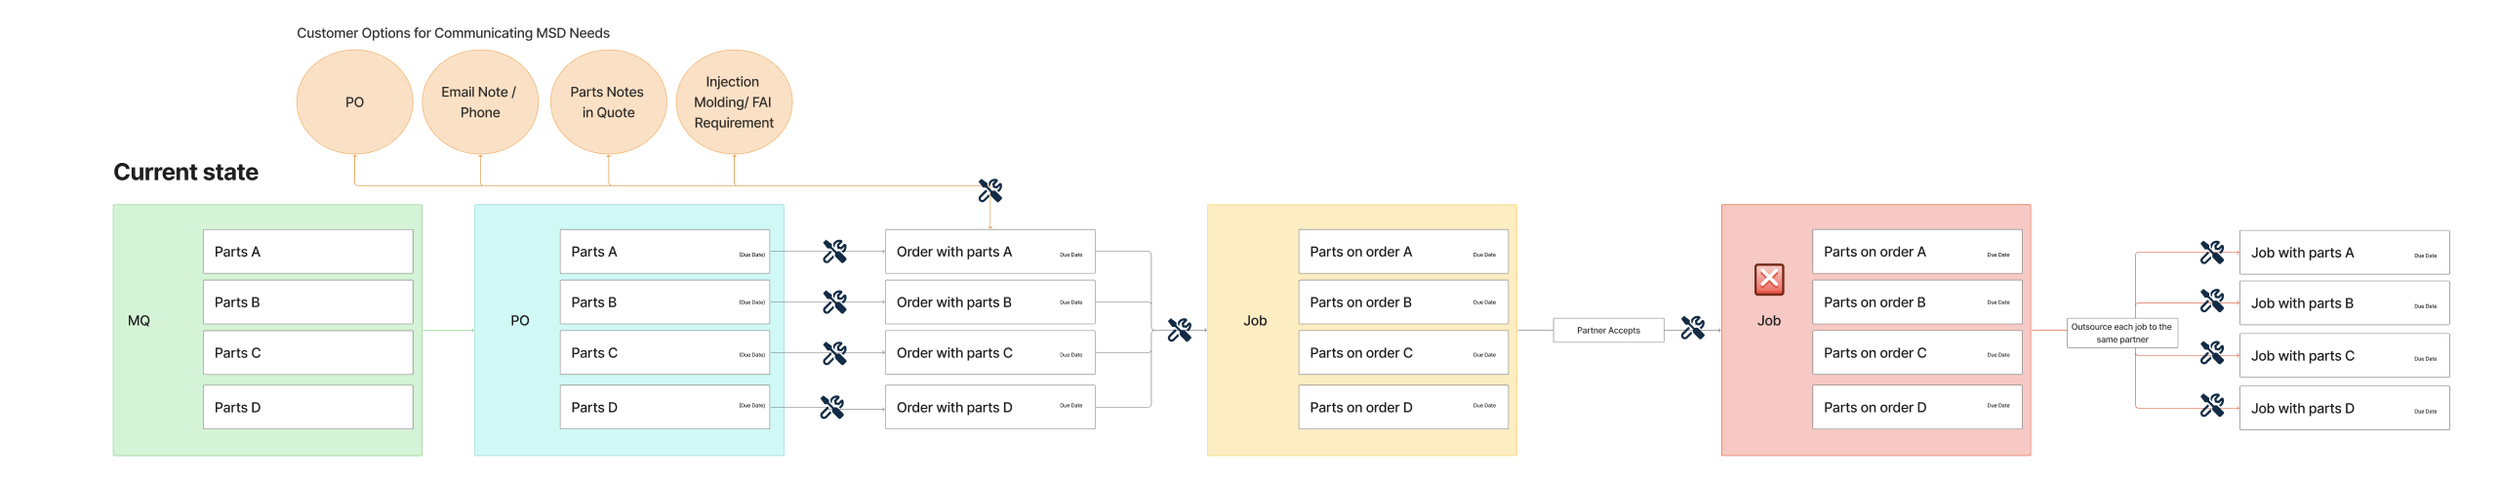
Icons indicate when manual work is required.
We used this same framework to map out the logic behind several potential high level solutions we wanted to explore. Here, you can see how the manual work icons allow viewers to quickly compare which potential solutions require more manual interventions.


Learnings
By shifting from a text-heavy to a visual-first approach, we successfully created a research deliverable that effectively communicated a complex problem and broke down the logic of the current state. This framework empowered stakeholders with the empathy and understanding needed to make informed decisions, ultimately leading to a more user-centered and effective solution. This case study demonstrates the power of visual storytelling in UX research, proving that a picture truly is worth a thousand data points.